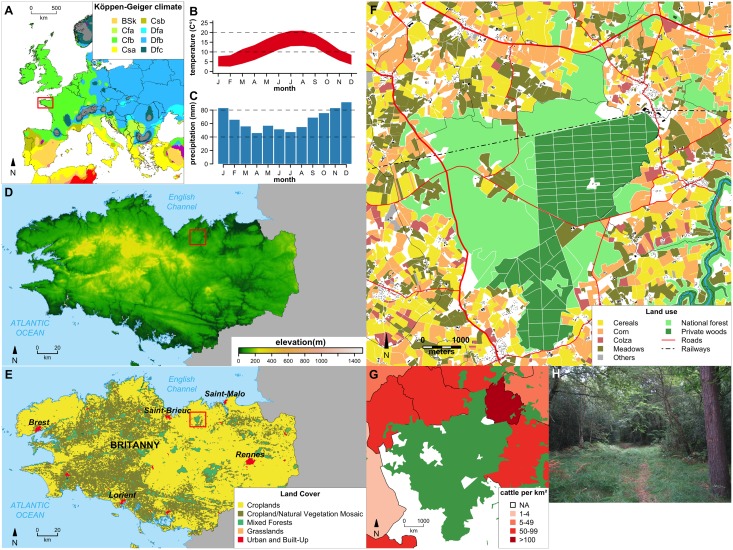
Fig 1. Detailed description of the sampling site.
(A) European map of the of Köppen-Geiger climate classification (from Peel et al, 2007). Location of Brittany is indicated by a red square. (B) Average monthly minimum and maximum temperatures for the La Hunaudaye Forest (from Hijmans, 2005). (C) Average monthly precipitations for the La Hunaudaye Forest (from Hijmans, 2005). (D) Brittany elevation map (from Jarvis et al. 2008). Location of La Hunaudaye Forest is indicated by a red square. (E) Brittany land cover (from Broxton et al. 2014). Location of La Hunaudaye Forest is indicated by a red square. (F) Detailed map of La Hunaudaye Forest and its vicinity with crop types. (G) Cattle per km. (H) Picture showing the ecological facies of the sampling site.

