
Figure 3.
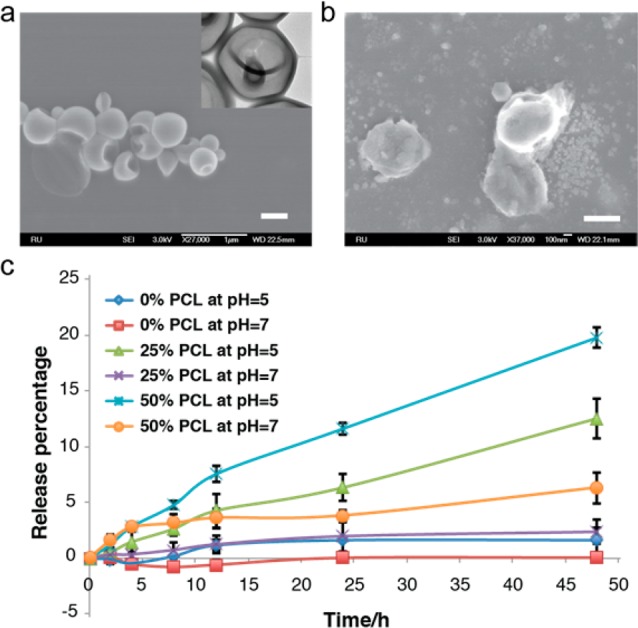
Pore formation of stomatocytes before and after degradation. (a) SEM images of stomatocytes with 50% PEG-b-PCL before acidic degradation (inset is a TEM image of a single stomatocyte with small opening). (b) SEM images of stomatocytes with 50% PEG-b-PCL after acidic degradation. (c) Release of Dox from a stomatocyte with different percentages of PCL at different pH. All scale bars are 400 nm.