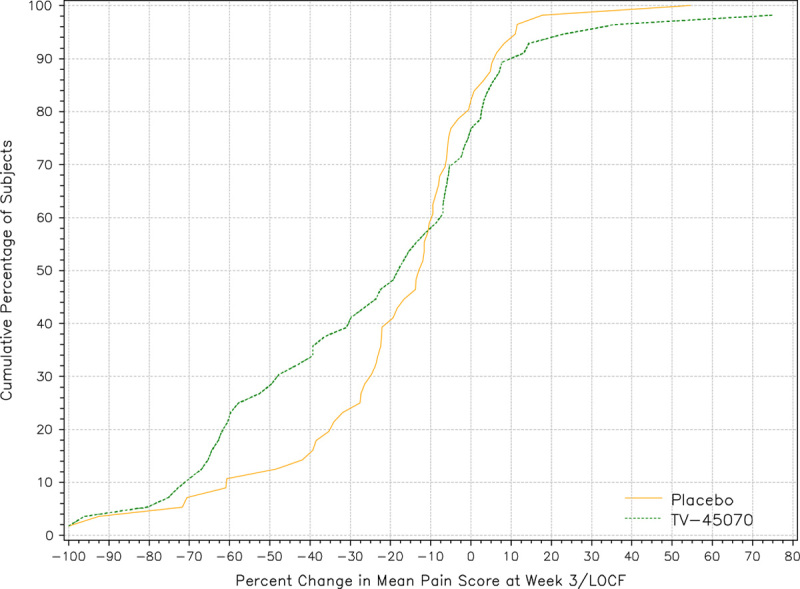
FIGURE 3.

Cumulative percentage of patients versus percent change in mean daily pain score at week 3/LOCF. The figure displays the cumulative percentage of patients versus percent change in mean daily pain score at week 3 with LOCF for the efficacy evaluable population. There is a noticeable separation between the 2 curves, indicating that more patients experienced a 10% to 80% reduction in mean daily pain scores at the end of TV-45070 treatment compared with placebo treatment. For example, approximately 40% of patients reported a 30% or greater reduction in pain when on TV-45070 treatment, compared with just 24% of patients during placebo treatment. LOCF indicates last observation carried forward.
