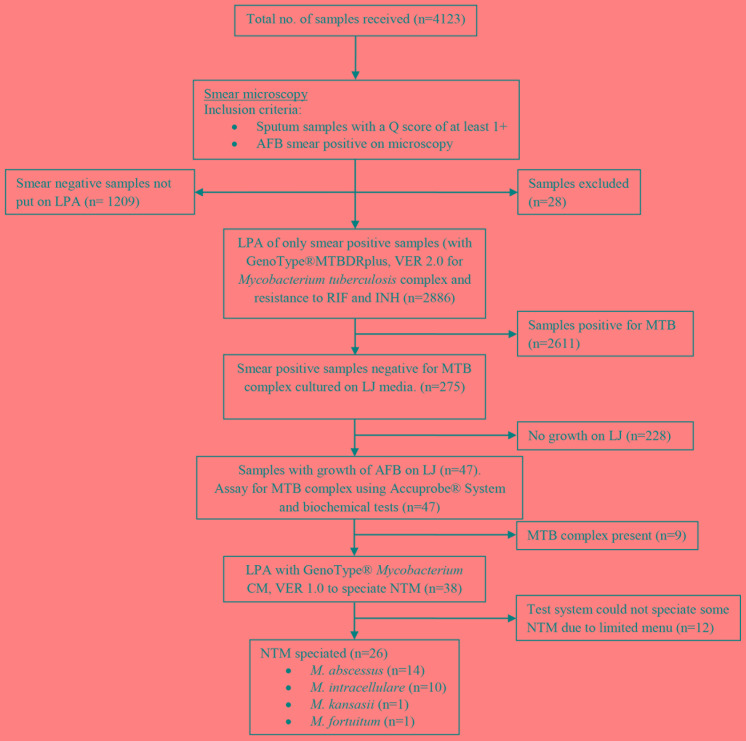
Figure 1. Study flow diagram showing samples included in the analysis and test results.
Sample quality rating was done by using the Q score, which assessed the numbers of neutrophils (0 to +3) and squamous epithelial cells (-3 to 0) per low-powered field (10x).
AFB – acid fast bacilli; INH – isoniazid; LJ – Löwenstein-Jensen; LPA – line probe assay; MTB – Mycobacterium tuberculosis; NTM – non-tuberculous mycobacteria; RIF – rifampicin.

