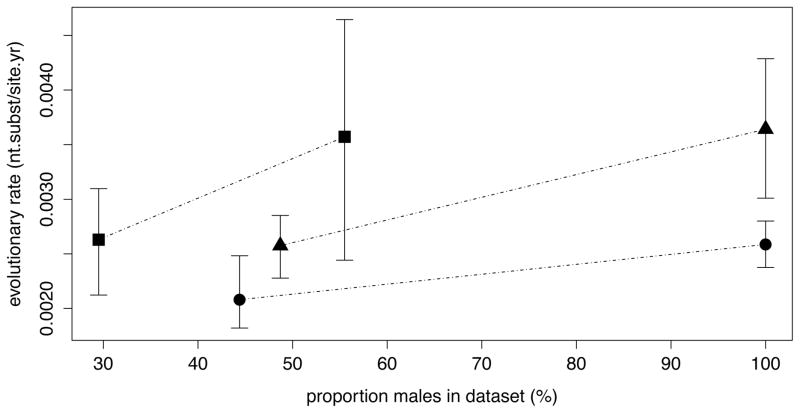
Figure 2. Illustration of the effect of the proportion of males on the rate estimate.
The means of the rate estimates are indicated by symbols, and the whiskers delimitate the credible interval. Squares: subtA1; Triangles: CRF01 AE; Circles: subtB. The impact of the male proportion is visualized as the slope between the mean of the rate estimates of the risk groups per subtype.

