Figure 5.
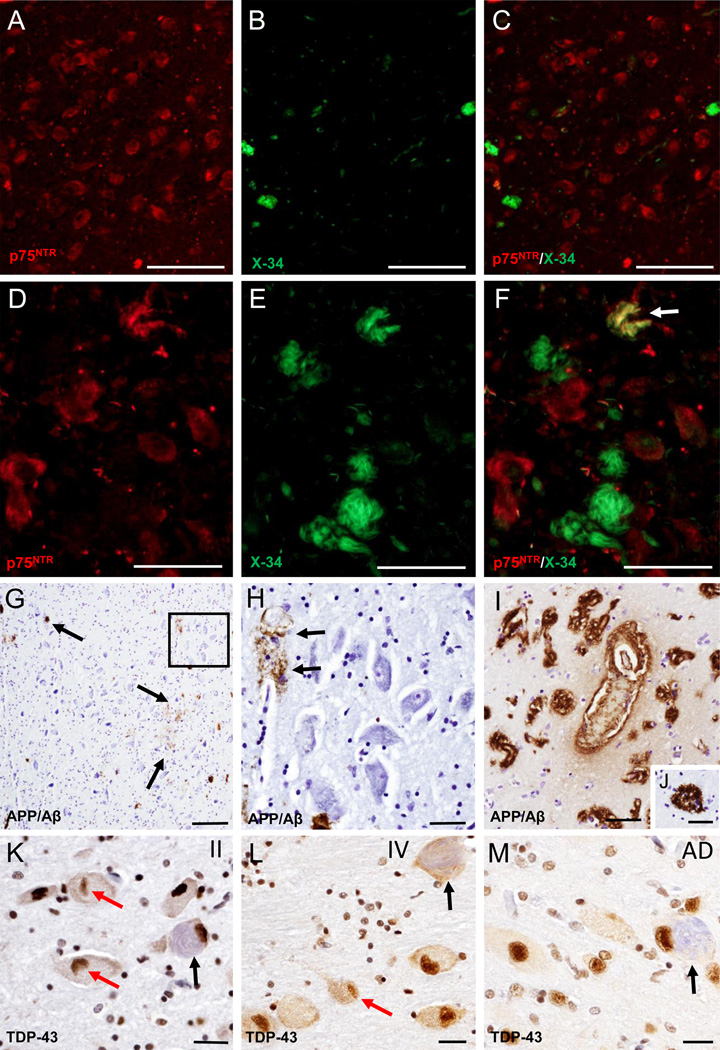
A–F. Fluorescence images of single p75NTR (red) (A and D) and X-34 (green) (B and E) staining and merged-images (C and F) showing limited of X-34 positive neurons (B) and the absence of double p75NTR/X-34 positive neurons (C) in the nbM in a CTE stage II case, while many more fibrillary X-34 positive neurons (E and F) were seen in the anterior subfields of the nbM in a CTE stage IV case. Arrow in F indicates a double immunolabeled p75NTR/X-34 neuron (yellow). G. Low magnification image of scattered APP/Aβ (6E10) labeled deposits (brown; arrows) in the nbM anteromedial subfield of a CTE stage IV case. H. High power image of APP/Aβ-positive blood vessel (arrows) from the area boxed in panel G; note the lack of intraneuronal APP/Aβ immunostaning in the large hyperchromic nbM neurons (blue). I–M. Images showing APP/Aβ positive deposits in blood vessels (bv) in the insular cortex as well as APP/Aβ reactive cored neuritic plaques in the temporal cortex (J) from a stage IV CTE case. N. K–M. Images showing nuclear TDP-43 staining (brown) in the nbM neurons from a CTE stage II (K), IV (L) and an AD case (M). Note the presence of lenticular shaped TPD-43-ir inclusions (red arrows) within nbM neurons in a CTE stage II (K) and IV (L), but not in the AD case (M). Black arrows indicate NFT-containing neurons (light blue) in CTE and AD cases. Sections in panels K–M were counterstained with hematoxylin. Scale bars: 200 µm (G), 100 µm (A–C), 50 µm (D–H, J), 40 µm (I), 25 µm (K–M)

