
Fig. 15.10.
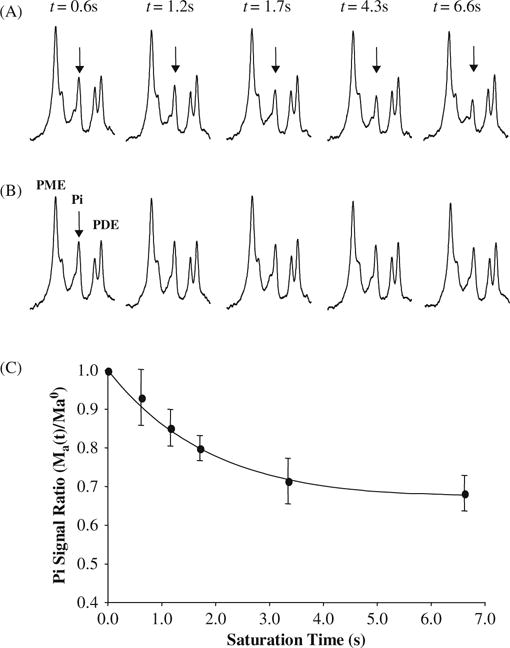
(A) Progressive saturation measurements and averaged in vivo 31P spectra (partially displayed) as a function of γ-ATP saturation time (t), and (B) their corresponding control 31P spectra. The arrows point to the Pi resonance peak. (C) Normalized Pi signal change as a function of t and regression fitting (solid line) according to Eq. (15.13a). Adapted from Lei et al. of Ref. (20).