
Fig. 15.7.
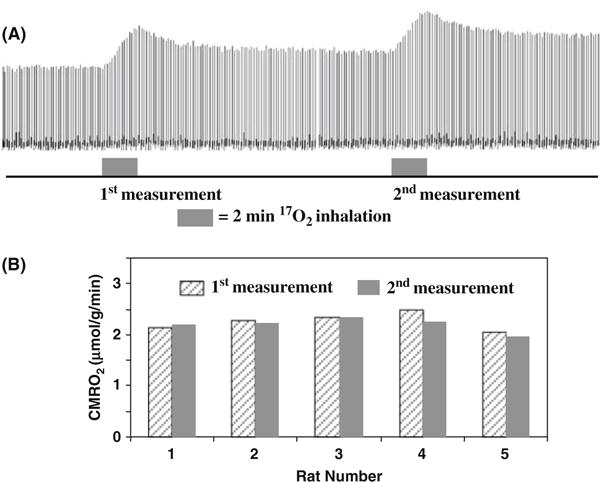
(A) Stacked plots of H217O spectra from a representative voxel of 3D 17O MRSI data acquired before, during and after two consecutive two-min 17O2 inhalations in a rat brain. (B) The comparison results between two repeated CMRO2 measurements in five rat brains. Adapted from Zhu et al of Ref. (86).