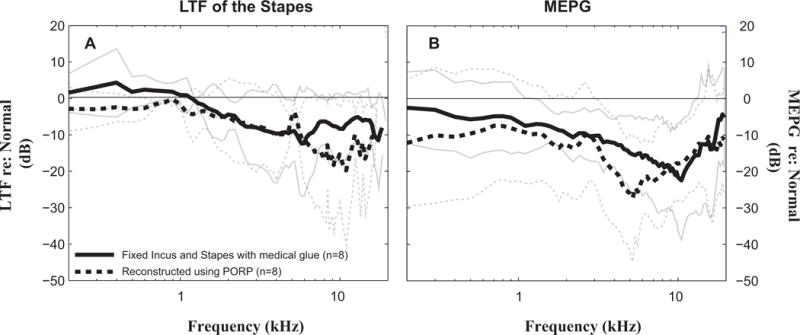
Figure 6. Outcomes of middle-ear repair or reconstruction.

A: Mean differences ± 1 standard deviation of stapes LTFs from the normal-control condition. (averaged across eight temporal bones); B: Mean differences ± 1 standard deviation of MEPG from the normal-control condition. (averaged across eight temporal bones). Solid and dashed lines represent glued and PORP conditions, respectively.
