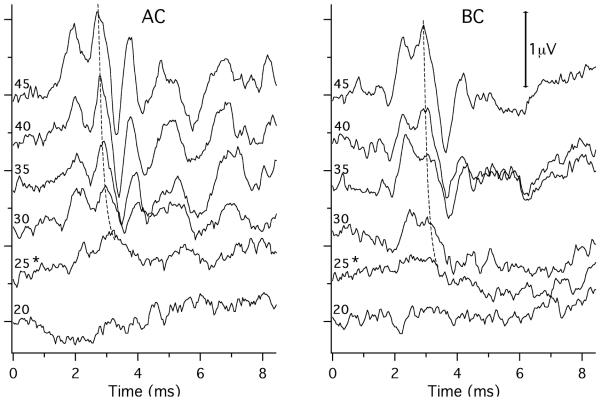
Figure 2.
ABR waveforms at different stimulus levels in response to AC and BC stimuli at 11.3 kHz. The 5-ms tone pips started at time 0. Near vertical thin, dashed lines connect points of similar activity on the curves. The ‘*’s mark the estimated thresholds, which was defined as the lowest level where we see a repeating temporal pattern in the waveform that has a magnitude above the background variation and is visible with higher stimulus levels. The left-hand sides of the curves are labeled by the stimulus level used to produce the averaged waveforms: AC is reported in dB SPL; BC is reported in dB re 1 cm/s2.

