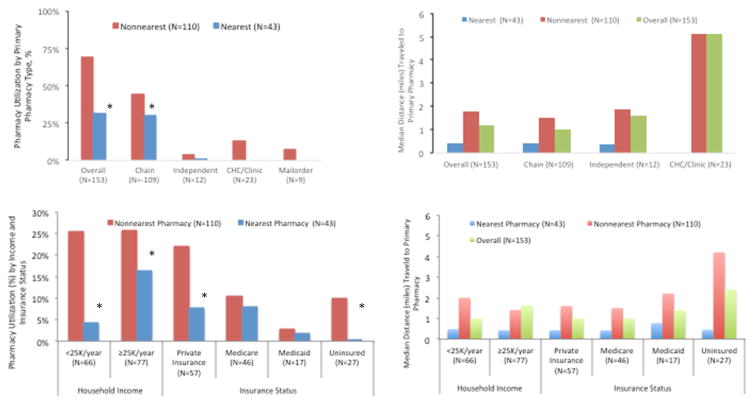
FIGURE 2.
PHARMACY AND INDIVIDUAL CHARACTERISTICS ASSOCIATED WITH PHARMACY UTILIZATION AND DISTANCE TRAVELED TO PRIMARY PHARMACY OVERALL AND ACCORDING TO USE OF NEAREST PHARMACY (N=153)
Notes: 16/169 respondents excluded due to missing data on nearest or primary pharmacy type. Pearson chi-square was used to test the difference between proportion of users and non-users of nearest pharmacy. Wilcoxon rank sum statistics was used to test the differences between the median distance traveled to primary pharmacy between users and non-users of nearest pharmacy. * Statistically significant (p<0.05). Statistically significant differences were found comparing users and non-users of nearest pharmacy for all pharmacy types and individual characteristics (p<0.05).

