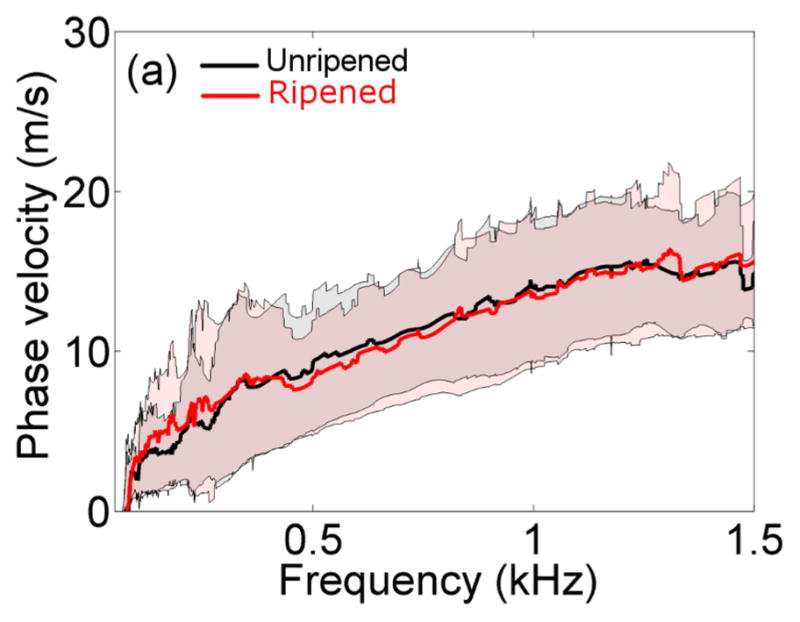
Figure 6.

Non-parametric estimates of the phase velocity as a function of the frequency at the transition zone in the unripened (black) vs. ripened (red) groups. The thick lines indicate the mean between specimens, and shadowed areas indicate ± one standard deviation.
