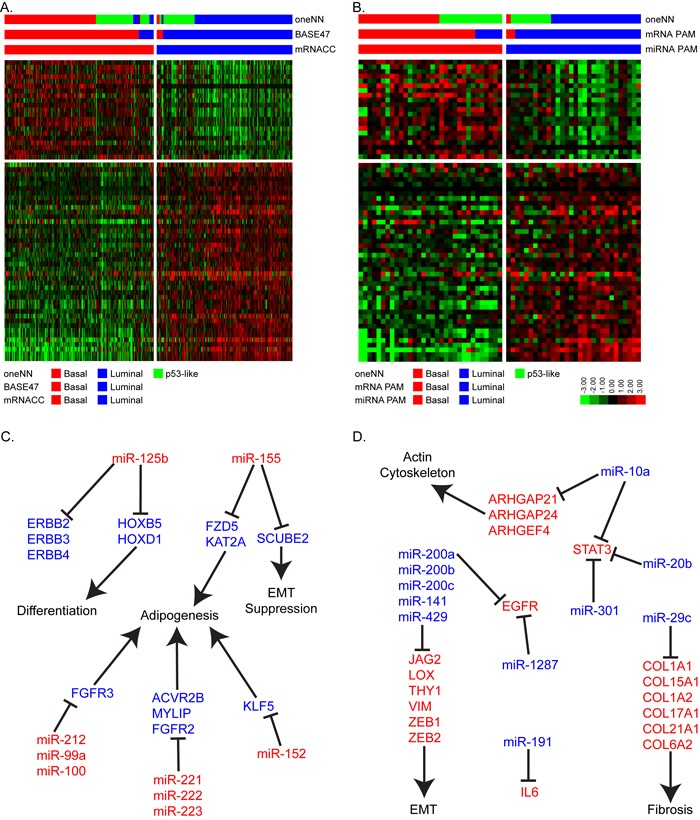
Figure 3. Micro-RNA PAM identifies basal and luminal tumors.

A. The heatmap depicts relative expression of 63 miRNAs identified by PAM to accurately assign basal and luminal tumors in TCGA's cohort (n = 405). B. The heatmap depicts relative expression of the 63-miRNA predictor in the FF cohort (n = 62). C. Schematic representation of basal miRNAs and their luminal associated mRNA target genes and pathways. D. Schematic representation of luminal miRNAs and their basal associated mRNA target genes and pathways.
