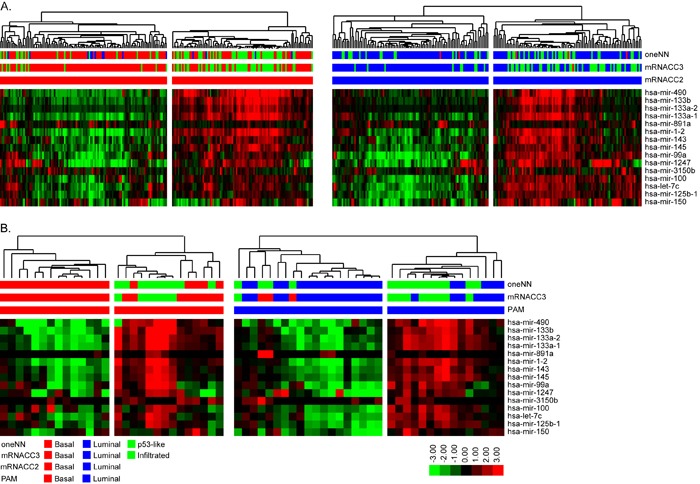
Figure 4. Differential expression analysis identified 15 miRNAs that define infiltrated/p53-like subsets of the basal and luminal subtypes.

A. Hierarchical clustering was performed with the 15-miRNA signature in TCGA's cohort. (Left) Basal tumors identified by mRNA CC were isolated and clustered. The heatmap depicts relative expression of the 15-miRNA signature. (Right) Luminal tumors identified by mRNA CC were isolated and clustered. The heatmap depicts relative expression of the 15-miRNA signature. B. Hierarchical clustering with the 15-miRNA signature in the FF cohort. (Left) Basal tumors identified by mRNA PAM prediction were isolated and clustered. The heatmap depicts relative expression of the 15-miRNA signature. (Right) Luminal tumors identified by mRNA PAM prediction were isolated and clustered. The heatmap depicts relative expression of the 15-miRNA signature.
