
Figure 1. Increased OGT expression in diffuse large B-cell lymphoma (DLBCL cells) and association with poor patient survival.
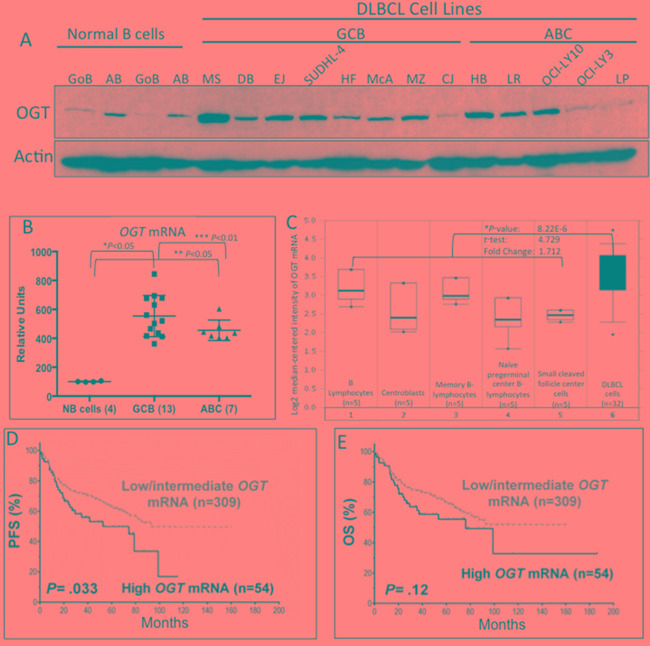
A. Western blot results demonstrate that most DLBCL cell lines have higher protein expression of O-linked N-acetylglucosamine transferase (OGT) than normal B-lymphocytes. Abbreviations: GoB, unstimulated B-lymphocytes; AB, activated B-lymphocytes; SU4, SUDHL-4; LY3, OCI-LY3; LY10, OCI-LY10; GCB, germinal center–derived B-lymphocytes; ABC, activated B-cell. Normal B-cells were obtained from blood samples from two different healthy donors. B. Gene expression profiling of OGT mRNA in DLBCL cell lines and normal B-cells. Abbreviations: NB, normal B-cells. *Comparison between normal B-cells and GCB DLBCL cell lines; **comparison between normal B-cells and ABC DLBCL cell lines; ***comparison between GCB and ABC DLBCL cell lines. C. mRNA expression in primary DLBCL and NB using the Oncomine database. The Student t-test was applied to the Oncomine results. The boxes represent the 25th through 75th percentiles. The horizontal lines represent the medians. The whiskers represent the 10th and 90th percentiles, and the asterisks represent the ranges. 1, B-lymphocytes (n=5); 2, centroblasts (n=5); 3, memory B-lymphocytes (n=5); 4, naïve pregerminal center B-lymphocytes (n=5); 5, small cleaved follicle center cells (n=5); 6, DLBCL cells (dark shade; n=32). *Comparison between the average of all B cell stages vs. DLBCL primary cells. D and E. Patients with de novo DLBCL and high OGT mRNA levels showed a trend for poor progression-free survival (PFS) and overall survival (OS)