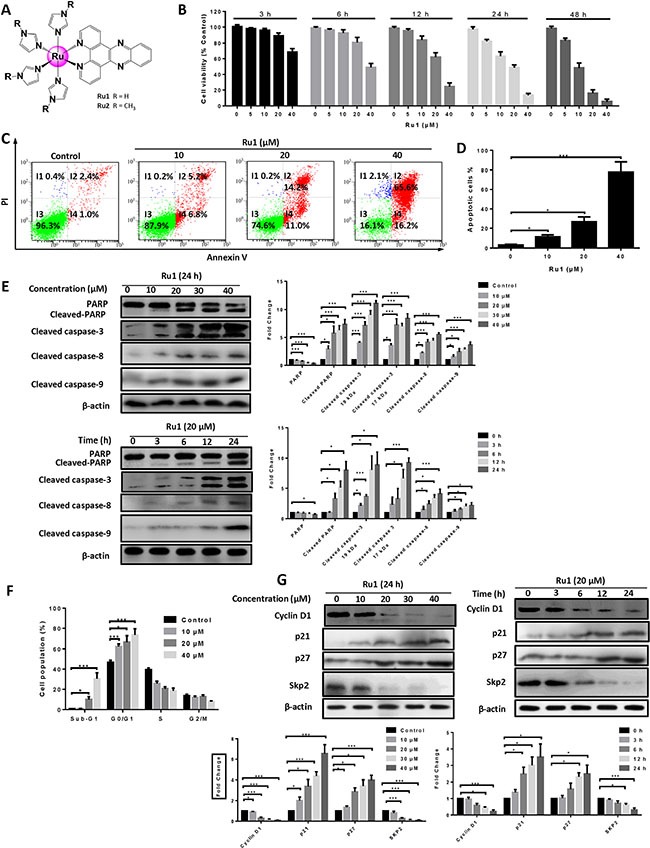
Figure 1. Ru1 induces growth inhibition and apoptosis in A549 cells.

(A) Structures of ruthenium imidazole/methylimidazole complexes Ru1 (R = H) and Ru2 (R = CH3). (B) The A549 cell viability was measured by MTT assay after Ru1 treatment for 3, 6, 12, 24 and 48 h. (C and D) A549 cells apoptosis was detected by annexin V/PI assay after co-incubation with 10, 20 and 40 μM of Ru1 for 24 h. (E) The expression level of cleaved caspase-3, cleaved-PARP, cleaved caspase-8 and cleaved caspase-9 were manifested in a time- and dose-dependent manner with Ru1 treatment. Right, quantification of the bands normalized by β-actin. (F) Cell cycle distribution was performed after co-incubation with 10, 20 and 40 μM of Ru1 for 24 h. (G) The expression levels of Cyclin D1, p21, p27 and Skp2 were evaluated in a time- and dose-dependent manner with Ru1 treatment. Below, quantification of the bands normalized by β-actin. Results were represented as mean ± SD (*p < 0.05, ***p < 0.001).
