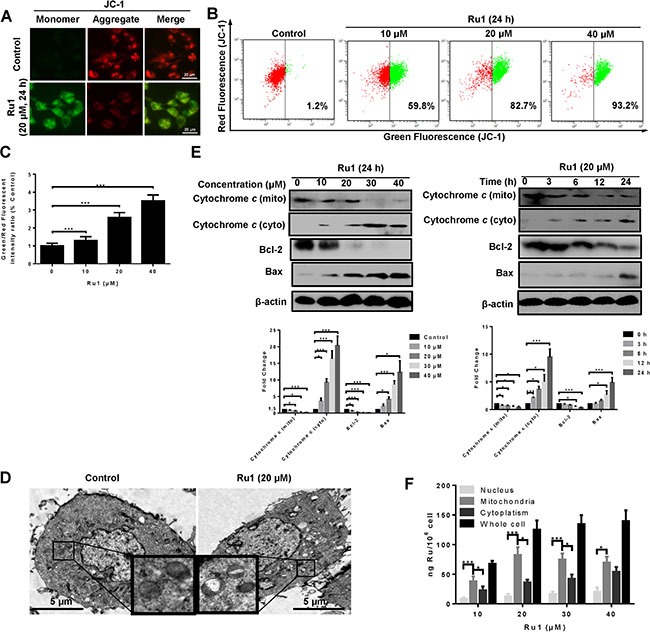
Figure 2. Ru1 induces mitochondrial dysfunction.

(A) Fluorescence microscope analysis of cellular MMP level by JC-1 staining after Ru1 treatment for 24 h. (B and C) Flow cytometry analysis of cellular MMP level after 10, 20 and 40 μM of Ru1 treatment for 24 h. (D) Two representative TEM images were identified to show the mitochondrial dysfunction after Ru1 treatment for 24 h. (E) The expression levels of cytochrome c, Bcl-2 and Bax were performed in a dose- and time-dependent manner. Below, quantification of the bands normalized by β-actin. (F) Ruthenium concentration in nucleus, mitochondria, cytoplasm, and whole cell (ng Ru/106 cells) in A549 cells after 24 h of exposure to different concentrations of Ru1. Results were represented as mean ± SD (***p < 0.001).
