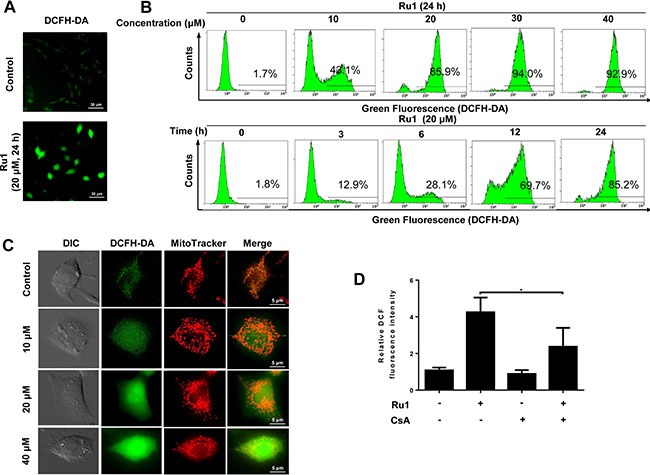
Figure 3. Ru1 stimulates generation of ROS from mitochondrial.

(A) Fluorescence microscope analysis of cellular ROS level by DCFH-DA staining after Ru1 treatment. (B) Flow cytometry analysis of cellular ROS level in a dose- and time-dependent manner after Ru1 treatment. (C) Ru1-triggered ROS co-localized with MitoTracker Red-stained mitochondria. Treated cells were stained with 20 nM of Mito Tracker-Red and 10 μM of DCFH-DA for 30 min. (D) Microplate analysis of cellular ROS level by DCFH-DA staining after 20 μM of Ru1 treatment for 24 h with, or without, 1-h CsA (2 μM) pre-treatment. Results were represented as mean ± SD (*p < 0.05).
