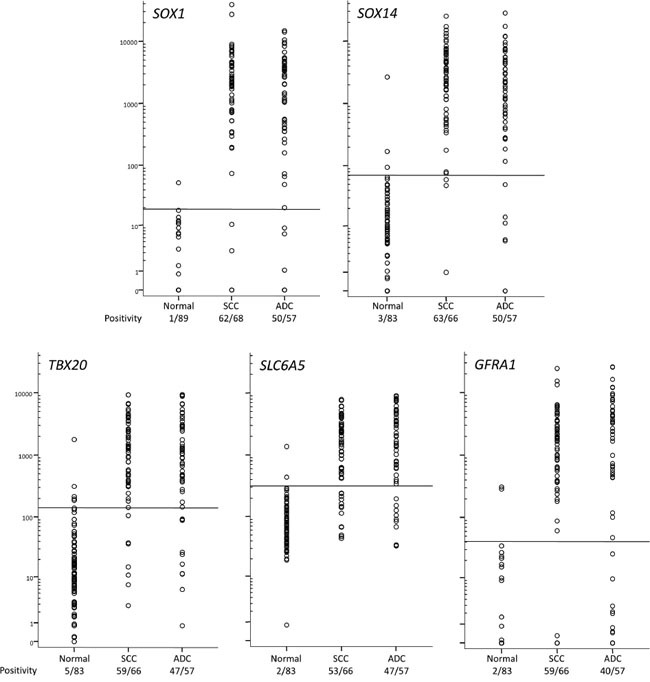
Figure 5. DNA methylation levels in normal and cancer scrapings determined by QMSP.

The horizontal lines represent optimal thresholds (see Table 2). The positive rate is depicted below the class labels.

The horizontal lines represent optimal thresholds (see Table 2). The positive rate is depicted below the class labels.