
Figure 10. Knockdown of Klotho gene expression increased invasion and IGF-1R and Akt phosphorylation.
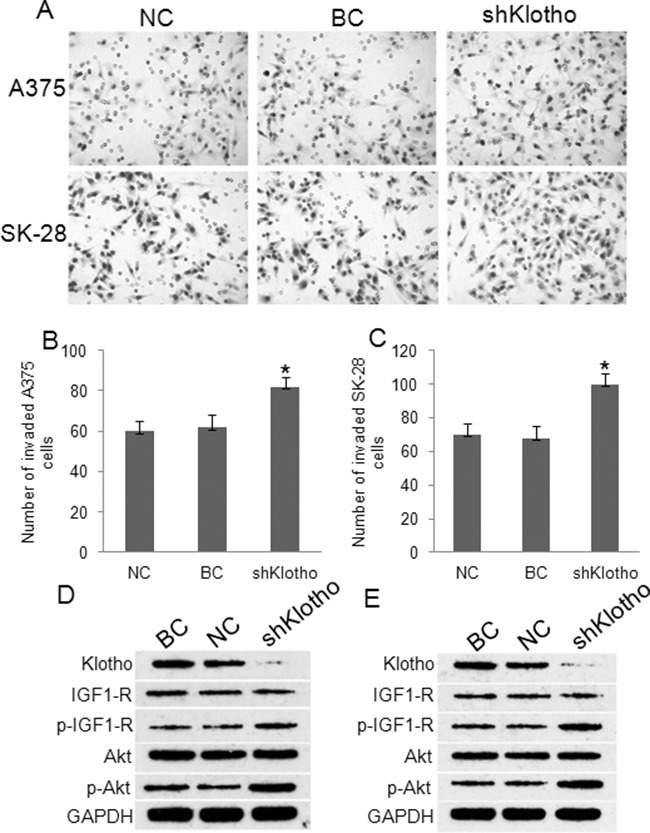
Cells were treated as described in Figure 8. NC: negative control. BC: blank control. shklotho: klotho shRNA expression. A. Representative photographs of cell invasion in A375 and SK-28 cells. B. The number of cell invasion in A375 cells. C. The number of cell invasion in SK-28 cells. *P<0.001 vs. other two groups. N=4. D. Representative Western blots of protein expression in A375 cells. E. Representative Western blots of protein expression in SK-28 cells. Expression of Klotho shRNA obviously inhibited Klotho protein expression, but increased IGF-1R and Akt phosphorylation in A375 and SK-28 melanoma cells.