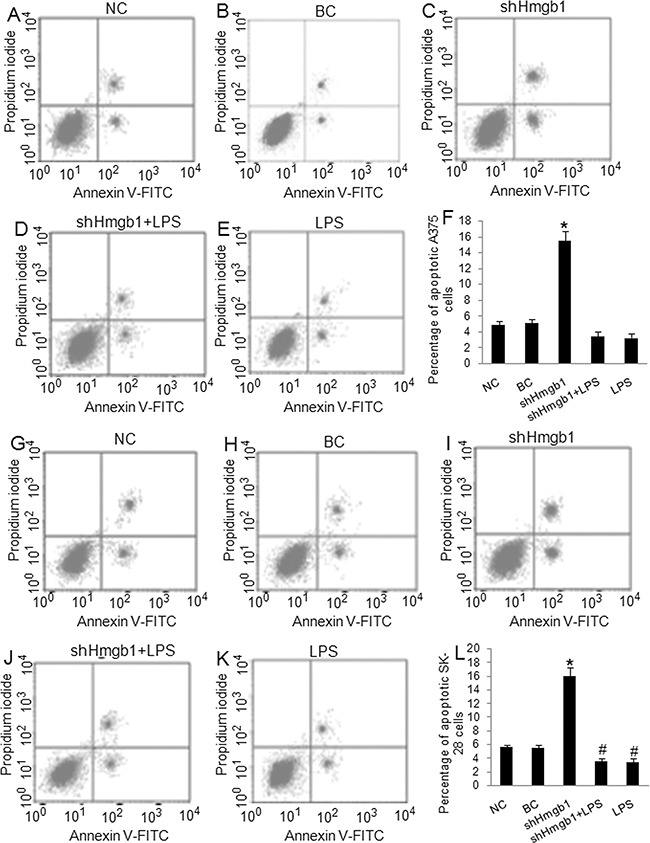
Figure 3. Knockdown of Hmgb1 expression increases apoptosis in melanoma cells.

Cells were treated as described in Figure 1. NC: negative control. BC: blank control. shHmgb1: Expressing Hmgb1 shRNA. shHmgb1+LPS: pGFP-shHmgb1 + LPS. LPS: LPS alone. A-E. Representative flow cytometry assay of apoptotic cells in A375 cells. The right up and down quadrant indicates the apoptotic cells. F. The percentage of apoptotic cells in treated A375 cells. G-K. Representative flow cytometry assay of apoptotic cells in SK-28 cells. The right up and down quadrant indicates the apoptotic cells. L. The percentage of apoptotic cells in treated SK-28 cells. *P<0.001 vs. other groups. #P<0.05 vs. NC and BC group. N=4.
