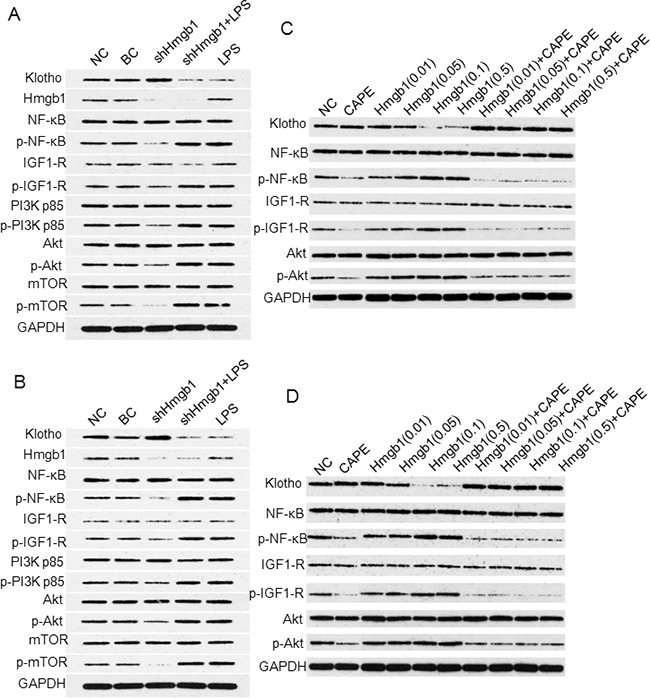
Figure 7. Western blot analysis of Klotho expression and NF-κB signaling.

Western blots for A375 A. and SK-28 B. cells treated with shHmgb1 and LPS. C. Western blots for A375 and D. for SK-28 cells treated with 0.01 μg/ml, 0.05 μg/ml, 0.1 μg/ml, and 0.5μg/ml of Hmgb1 with or without 100 μM of NF-κB inhibitor (CAPE) for 24 hrs.
