
Figure 2. OPLS-DA analysis based on 1H NMR data from cerebral extracts of all groups.
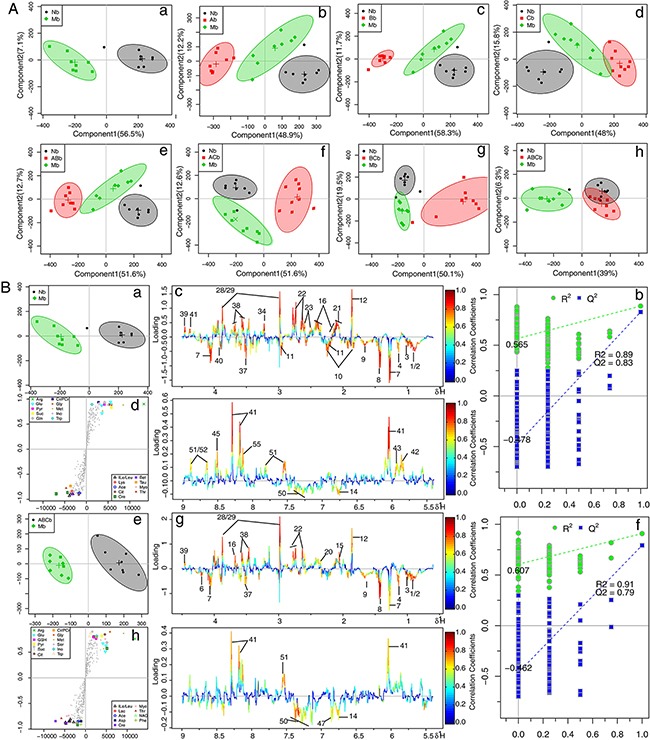
A. Score plots according to OSC-PLS-DA analysis based on 1H NMR data from cerebral extracts of rats. B. Color-coded loading plots, S-plots, and scatter plots of the statistical validations obtained by 2000X permutation tests for OSC-PLS-DA analysis in cerebrum. a, b and c: sham vs. MCAO; d, e and f:ABC vs. MCAO.