
Figure 4. Heatmap visualization of the metabolites in cerebral extracts and serum.
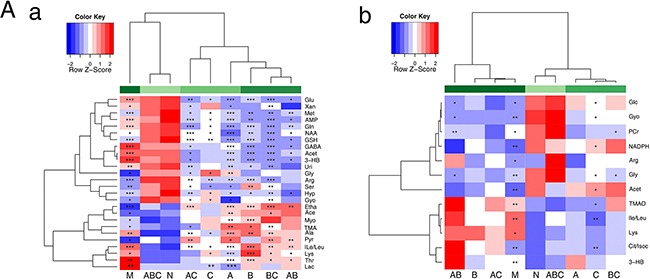
Heatmap visualization of the z-scored levels of metabolites in cerebral extracts A. and serum B. with stars denoting the significance. Rows represent metabolites and columns represent groups. All groups were compared with the sham group (N). Color key indicates metabolite quantities, white: no significant change, deep red: highest, deep blue: lowest. * P< 0.05, ** P< 0.01 and *** P< 0.001.