
Figure 7. mRNA expression and heatmap of all measured parameters.
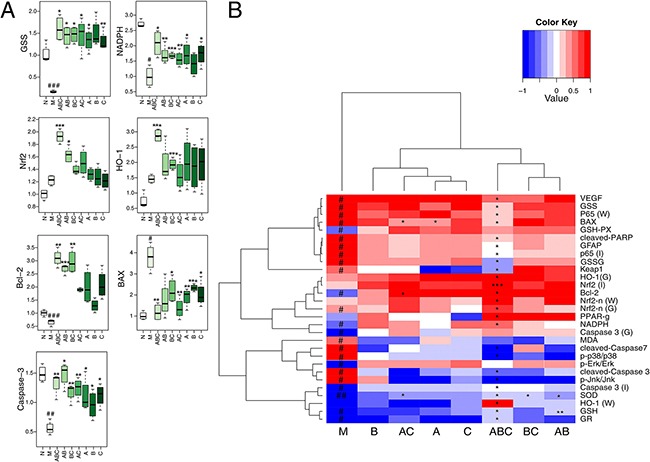
A. Boxplots for the mRNA expression analysis by RT-PCR in cerebrums. (n=6) B. The heatmap of all the parameters determined by biochemistry, immunohistochemistry (I), qRT-PCR (G), and western blotting (W). Results of quantitative analysis values are expressed as mean ± SD (n = 5). #: P < 0.05, ##: P< 0.01 and ###: P< 0.001 MCAO group vs. sham group; *: P < 0.05, **: P< 0.01 and ***: P< 0.001 Drug treated groups vs. MCAO group.