
Figure 8. Correlation network of differential metabolites in cerebral extracts and serum of all groups.
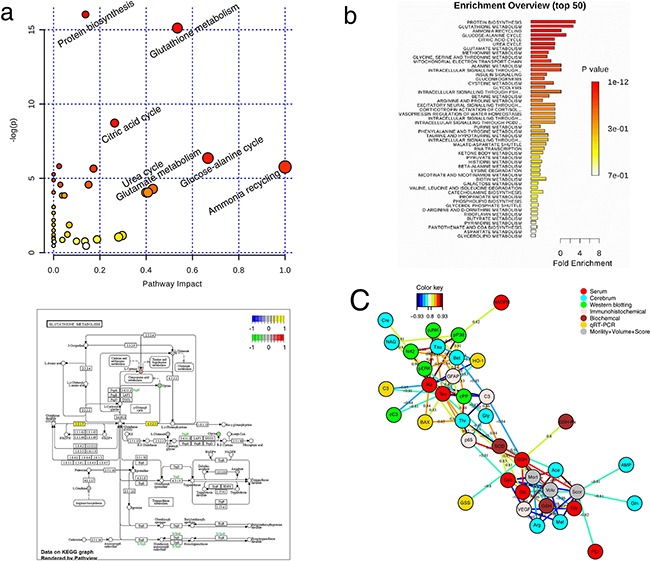
A. Disturbed metabolic pathway in MCAO rats as visualized by a: bubble plots and b: Enrichment Overview. B. Visualization of glutathione metabolism pathway relevant for I/R by KEGG. C. Correlation network determined by canonical (sparse-partial least squares, sPLS) analysis using metabolite concentrations as X variables and other parameters as Y variables. The network is graphically represented with metabolites and parameters as nodes, and correlations above a threshold (0.8) as edges (color coded according to the correlation coefficients, bluish for negative and reddish for positive correlations).