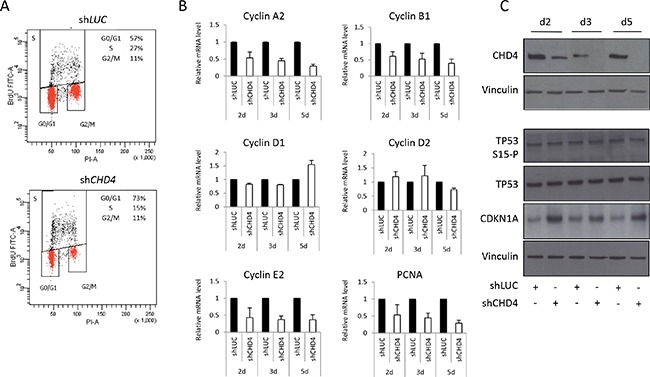
Figure 4. CHD4 function in MCF10DCIS.com cell cycle progression.

A. MCF10DCIS.com cells were infected with shCHD4 or control (shLUC) and after 5 days analyzed by flow cytometry for Bromodeoxyhuridine (BrDU) and PI content. Percentage (%) of cell population in each phase of cell cycle (G0/G1, S and G2/M) is reported within the panels. B. Effect of CHD4 silencing on the regulation of different genes controlling cell cycle progression and proliferation was detected by qPCR analysis at different time points (days – d) from infection. Histograms represent mRNA levels (mean ± SE of two independent experiments) of cyclin A2, cyclin B1, cyclin D1 and D2, cyclin E2, PCNA in MCF10DCIS.com cell line. RPLP0 was used as housekeeper. C. Total TP53, phospho-TP53 (serine15) and CDKN1A levels were analyzed, at different time points (days – d) from infection, by western blot in MCF10DCIS.com cells infected with shCHD4 and the control shLUC. Vinculin was used as normalizer.
