
Figure 5. Cell cycle progression, proliferation index and checkpoint activation analysis by high-content and high-resolution multiparameter image cytometry.
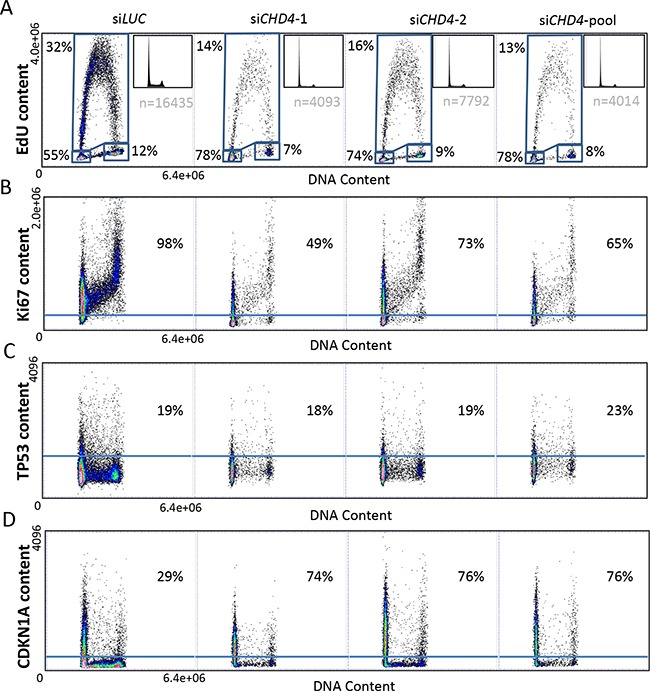
MCF10DCIS.com cells were transfected with two separate (siCHD4-1 and siCHD4-2) or pooled (siCHD4-pool) siRNAs against CHD4 or the control (siLUC). DNA content (x-axis) was correlated to the analyzed parameter (y-axis): EdU A. Ki67 B. TP53 C. CDKN1A D. content. Percentages of cells in each phase of cell cycle are reported with respect to the total cell population (A). Ki67 (B), TP53 (C) and CDKN1A (D) content are expressed as percentage with respect to the gated cell population.