
Figure 4. The number of DSB foci and DDR activation in long-term- and doxorubicin-treated neuronal cultures.
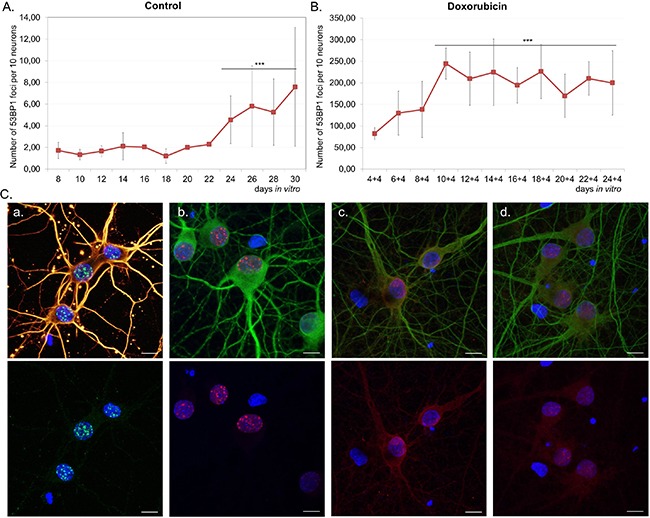
Neurons were cultivated untreated A. or treated with 10 nM doxorubicin for four days B. and stained for p53BP1. The average number of nuclear p53BP1 foci per ten neurons was calculated. For each culture at least 60 neurons were analysed at each time point. Values represent the mean ± S.D, ***P>0.001 by ANOVA from four independent experiments (control) and three independent experiments (doxorubicin); the mean value of 24-30 DIV relative to 8 DIV (for A), relative to 4+4 DIV (for B). C. DDR activation in 14 DIV neurons treated with doxorubicin. Images show staining for γH2AX (green), β-tubulin (yellow) (a), p53BP1(red), MAP2 (green) (b), P-ATM (Ser1981) (red), MAP2 (green) (c), P-CHK2 (Thr68) (red), MAP2 (green) (d). Scale bars represent 10 μm.