
Figure 5. Doxorubicin-treated cultures do not have more SA-β-gal-positive neurons than untreated ones.
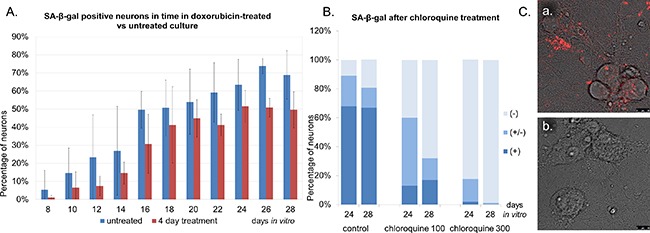
A. Neurons were treated with 10 nM doxorubicin for four days or cultivated untreated and stained for SA-β-gal. Quantitative analysis of the mean number of neurons with high SA-β-gal signal in untreated- versus doxorubicin-treated neurons. Values represent the mean ± S.D. from at least three independent experiments. B. A dose-dependent decrease in the number of SA-β-gal-positive neurons after chloroquine treatment. SA-β-gal (+): high, (+/-): low, (-): undetectable. C. A representative image of LysoTracker Red- stained neurons: control (a) or treated with chloroquine (b). Scale bars represent 10 μm.