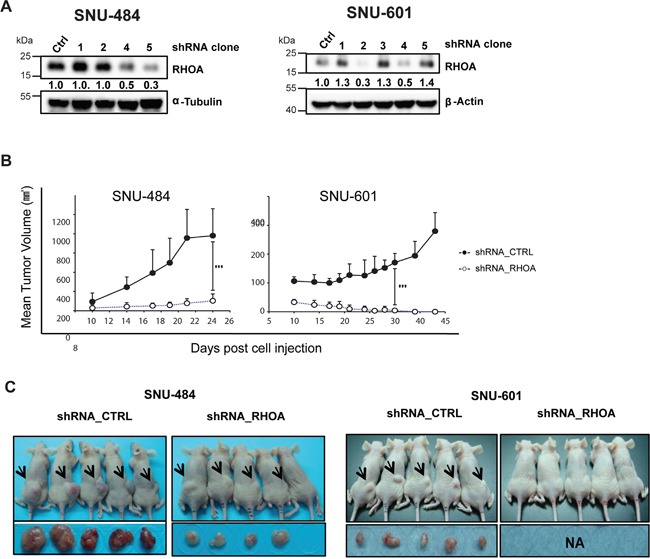
Figure 5. In vivo xenograft model of shRHOA shows decreased tumor size.

A. Western blot analysis shows different knockdown efficiencies of each clone after lentiviral infection of RHOA shRNA. B. tumor growth was measured from day 10 of inoculation and was monitored until the animals were sacrificed. Tumor growth suppression was observed in RHOA shRNA knockdown tumors (SNU-484 and SNU-601), as compared to the various control groups. *** p-value: SNU-484p-value = 0.0061, SNU-601 p-value = 0.0004) C. photograph of mice bearing xenograft tumors. Arrows indicate the location of the tumors. Tumor sizes from the RHOA knockdown cells were smaller in SNU-484 GC cells, and failed to grow in SNU-601 cells.
