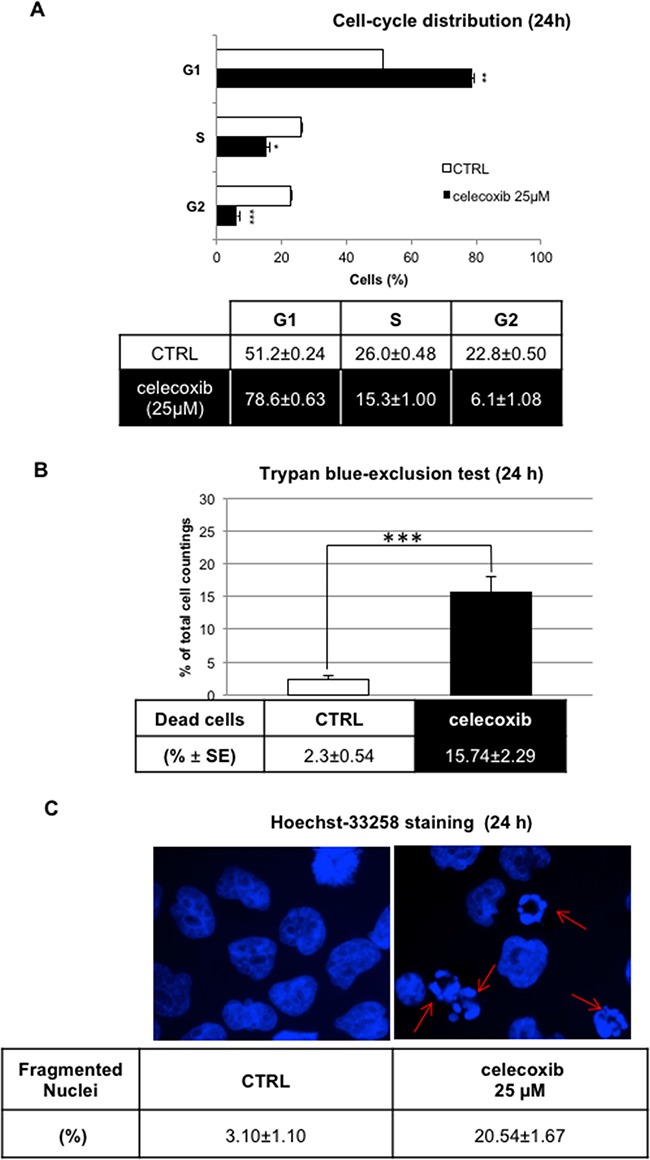
Figure 2. Effect of celecoxib on Ph+ cell viability by DNA content analysis.

A. LAMA-84 cell-cycle distribution assessed by flow cytometry after propidium iodide staining. Results (means ± S.E.M of n=3 samples; *P ≤ 0.05, **P ≤ 0.01, ***P ≤ 0.001) depict a representative experiment of three experiments that yielded overlapping results. B. Trypan-blue exclusion test on LAMA-84 cells treated with celecoxib (25 μM) for 24 hours.A minimum of 100 cells was scored for each condition. Data on table represent the means of three independent experiments ± S.E.M. ***P ≤ 0.001 C. UV-fluorescence(60 x magnification) of Hoechst33258-stained LAMA-84 cell nuclei after 24-hours treatment. Arrows indicate the fragmented nuclei of apoptotic cells. Data represent mean percentages of apoptotic cells from three independent experiments ± S.E.M.
