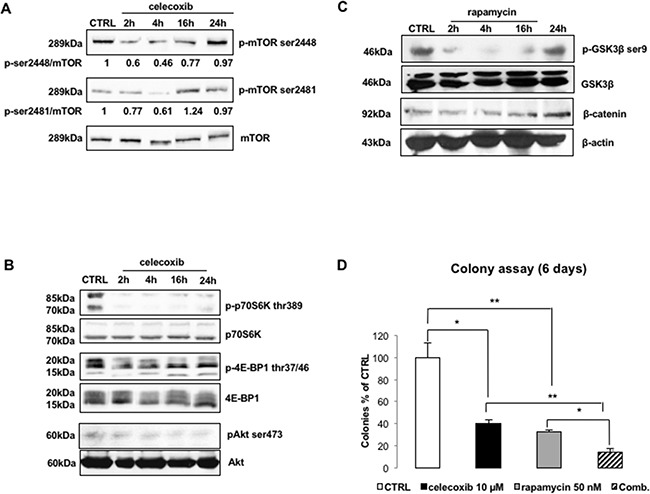
Figure 5. Celecoxib modulates the activity of mTOR kinase.

A. Immunoblots of LAMA-84 lysates treated with celecoxib (25 μM) to explore mTOR phosphorylation. Values underneath lanes represent the optical densities of p-mTOR immuno-reactive bands corrected by the total levels of mTOR. B. Immunoblots of LAMA-84 lysates treated with celecoxib (25 μM) to explore phosphorylation/activation of mTORC1 and mTORC2 down-stream targets (p-p70S6K thr-389, p-4E-BP1 thr-37/46, pAkt ser-473). Levels of total p70S6K, 4E-BP1 and Akt are displayed to compare protein loadings between lanes. C. Time-course of GSK3β phosphorylation (p-GSK3β-ser9) and β-catenin (β-cat) protein expression following to inhibition of mTORC1 complex in LAMA-84 cells treated with 50 nM rapamycin. Levels of β-actin (β-act) are displayed as proof of equal loading between lanes. D. mTORC1 inhibition and CML cell clonogenicity. LAMA-84 cells were exposed to 50 nM of rapamycin, alone or in combination (Comb) with 10 μM celecoxib. Results are expressed as percentages of colonies counted, after 6 days, in drug-treated groups as compared to controls. Data represent averages of three independent experiments made in duplicate. *P ≤ 0.05, **P ≤ 0.01.
