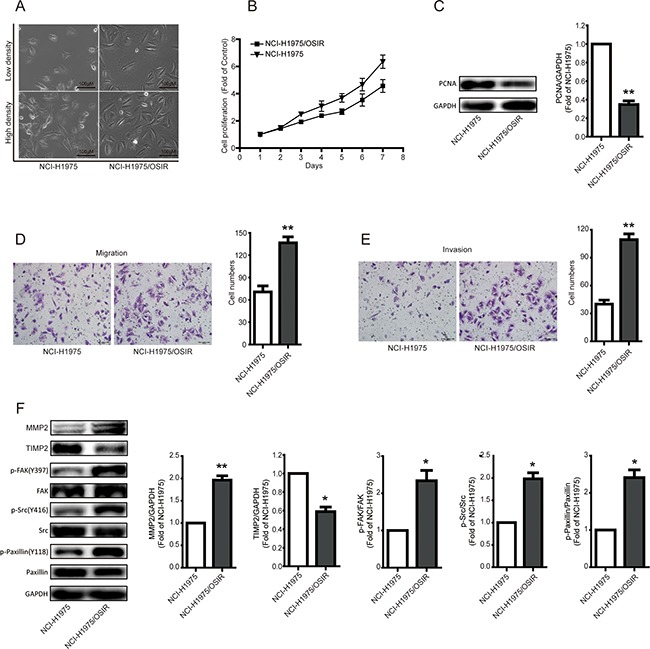
Figure 2. Characterization of the proliferation, migration, and invasion abilities of NCI-H1975 and NCI-H1975/OSIR cells.

A. After cells adhered to 6-well plate for 24h, the cell morphology was imaged and typical photos were presented. B. After NCI-H1975 and NCI-H1975/OSIR cells were plated in 96-well plate at same concentration, the cell proliferation was detected by MTT assay as indicated days. C. The protein expression of PCNA was determined by western blot assay. *P<0.05 and **P<0.01. D, E. the migration and invasion of NCI-H1975 and NCI-H1975/OSIR cells were determined by transwell assay. The migration and invasion ability of cells was determined by counting cell numbers that migrated or invaded the underside of the porous polycarbonate membrane by crystal violet staining. Typical images were photographed and presented. The quantification result was obtained from three independent experiments. *P<0.05 and **P<0.01. F. The expressions of indicated proteins were determined by western blot assay. *P<0.05 and **P<0.01.
