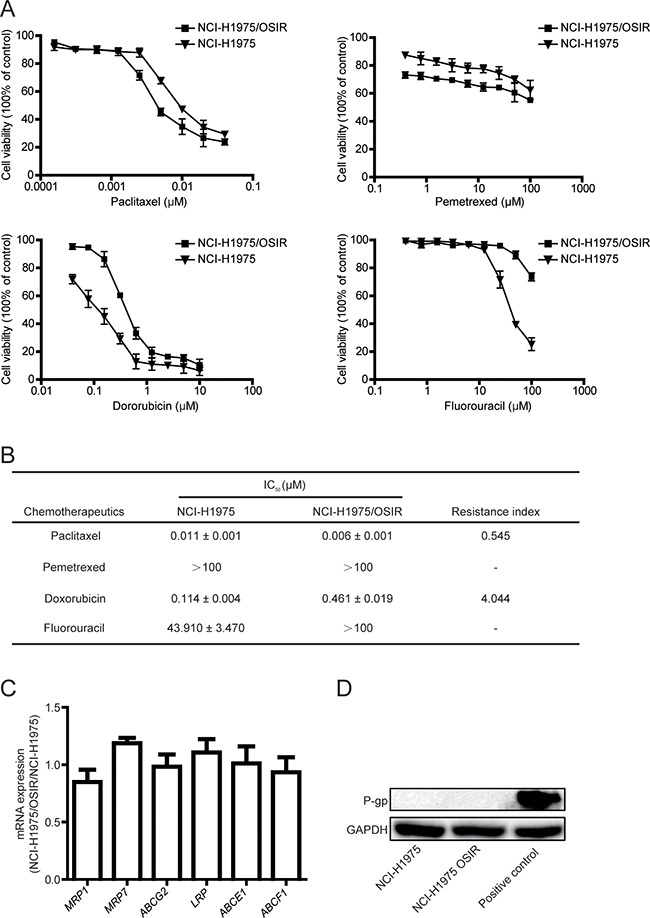
Figure 4. Characterization of the sensitivity of NCI-H1975 and NCI-H1975/OSIR cells to chemotherapeutics.

A. After cells were exposed to various concentrations of chemotherapeutics for 72 h, the cell viability was detected by MTT assay. B. The IC50 values of chemotherapeutics in NCI-H1975 and NCI-H1975/OSIR cells. “-” means “cannot statistics”. C. The mRNA levels of indicated genes in NCI-H1975 cells and NCI-H1975/OSIR cells were determined by RT-PCR. D. The cell proteins were extracted and the expressions of P-gp and GAPDH were studied by western blot.
