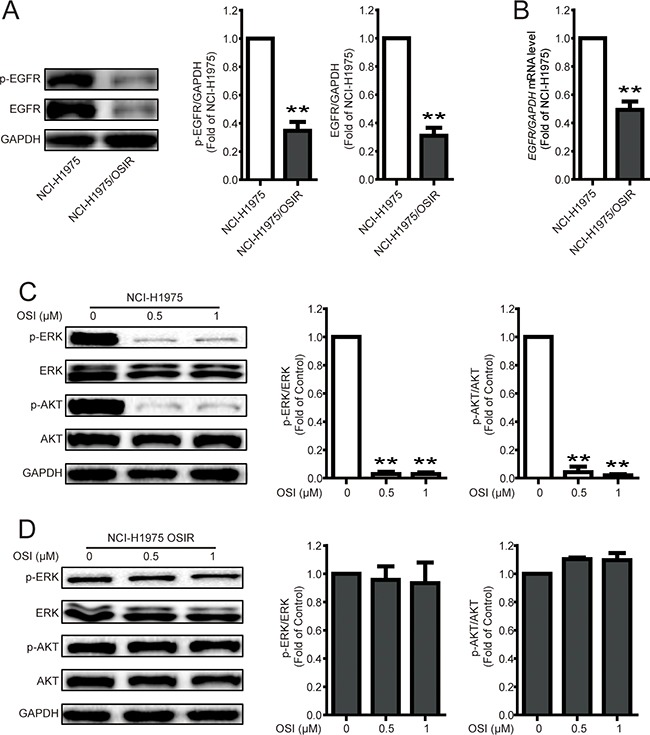
Figure 5. Characterization of EGFR and the downstream proteins in NCI-H1975 and NCI-H1975/OSIR cells.

A. After cells were plated for 24 h, the cell proteins were extracted and the expressions of p-EGFR, EGFR, and GAPDH were studied by western blot. *P<0.05 and **P<0.01. B. The mRNA levels of EGFR in NCI-H1975 and NCI-H1975/OSIR cells were determined by RT-PCR. *P<0.05 and **P<0.01. C-D. NCI-H1975 and NCI-H1975/OSIR cells were cultured with indicated concentrations of OSI for 24 h. Cell extracts were analyzed for indicated protein expression using western blot analysis. The blots of Figure 5C and 5D were obtained under the same exposure time. *P<0.05 and **P<0.01.
