
Figure 1. Distribution of miRNA alterations in EOC as reported in 14 primary miRNA profiling datasets.
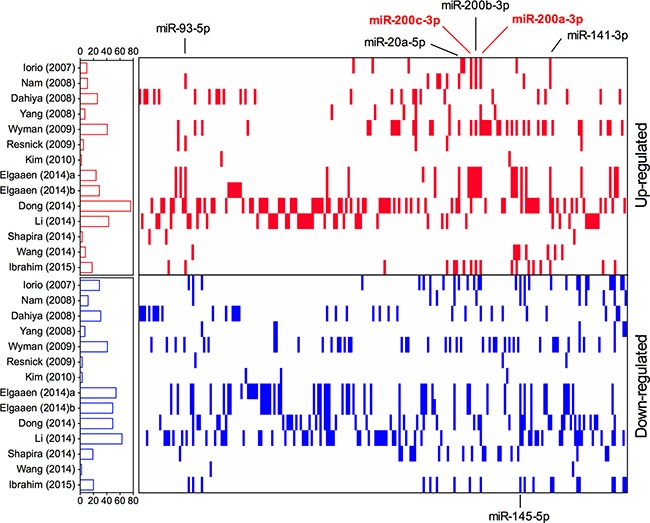
Short red and blue vertical bars indicated upregulated and downregulated miRNAs, respectively. miRNAs are aligned according to miRBase release 21. The number of miRNAs in each study is graphically depicted on the left. The positions of EOC integrated-signature miRNAs have been marked.