
Figure 3. Forest plots showing the sensitivity and specificity of miR-200a/c in the diagnosis of EOC.
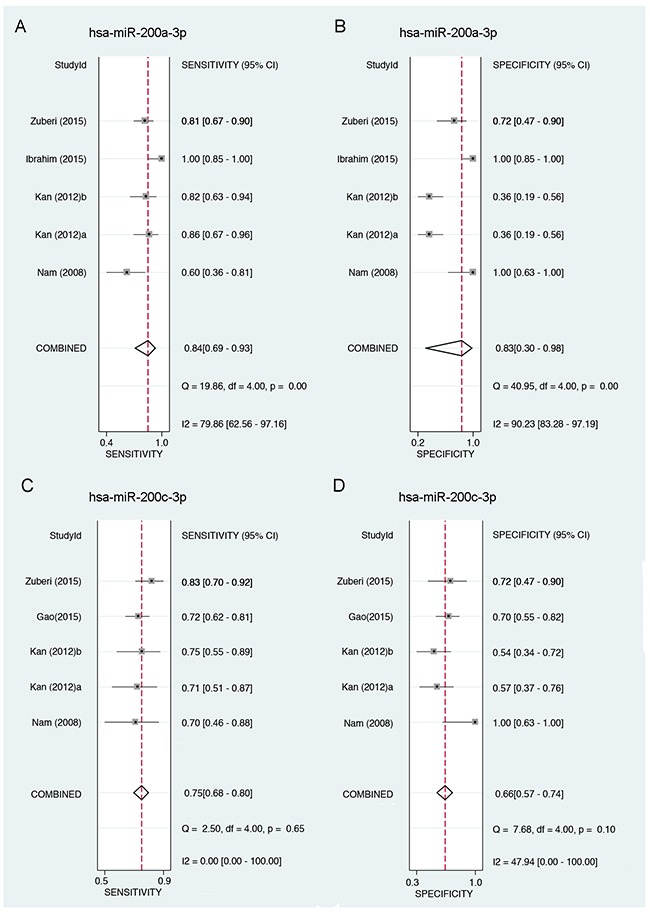
A. Forest plot showing the sensitivity of miR-200a-3p in the diagnosis of EOC. B. Forest plot showing the specificity of miR-200a-3p in the diagnosis of EOC. C. Forest plot showing the sensitivity of miR-200c-3p in the diagnosis of EOC. D. Forest plot showing the specificity of miR-200c-3p in the diagnosis of EOC. 95%CI: 95% of confidence interval; EOC: epithelial ovarian cancer.