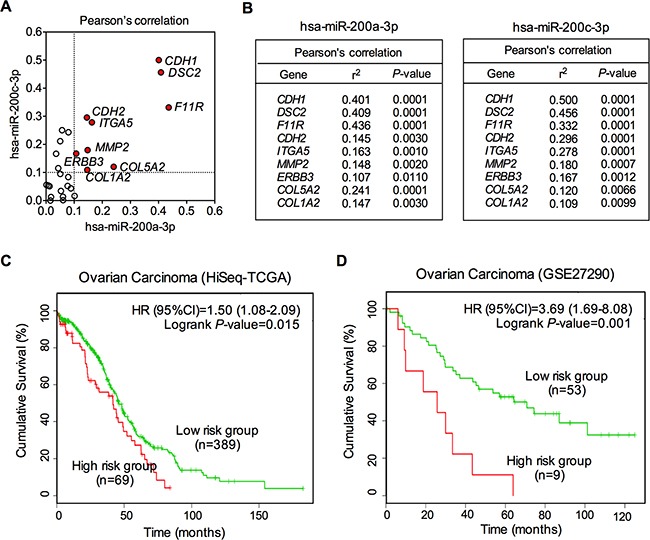
Figure 6. Correlation of miR-200a/c with cellular adhesion-related genes.

A. Schematic of Pearson's correlation of miR-200a/c with cellular adhesion-related genes. Genes with an r2 >0.1 were shown as red dots. B. Pearson's correlation of miR-200a/c with cellular adhesion-related genes. The r2 and P values for each of the top 9 genes were demonstrated for miR-200a and miR-200c. C. Kaplan–Meier analysis of overall survival for patients with different miR-200a/c expression levels. Data were drawn from two independent cohort studies (HiSeq-TCGA and GSE27290). The red lines represent the high risk groups, and the green lines represent the low risk groups.
