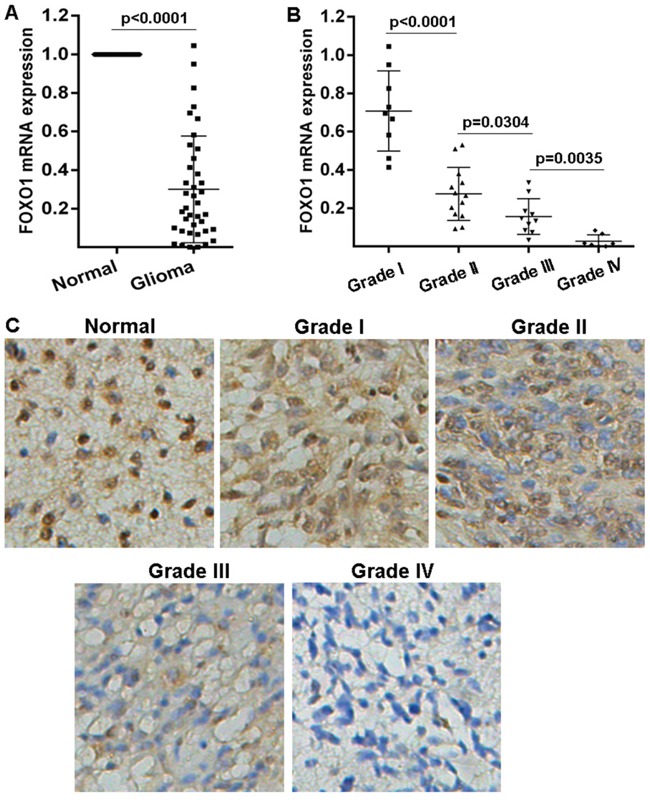
Figure 1. FOXO1 expression pattern in glioma.

A. FOXO1 mRNA level in glioma tissue samples represented as fold change were detected with qRT-PCR by normalizing to GAPDH as endogenous control and the expression level in matched non-tumor tissues was set as 1. B. The correlation between FOXO1 mRNA expression and glioma grades was analyzed. C. Representative images of FOXO1 protein level in glioma tissue samples detected by IHC (20×).
