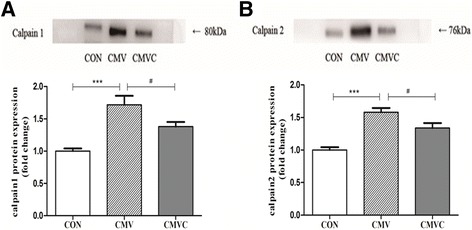
Fig. 3.

Protein levels of both calpain1 and calpain2 in the diaphragm. The images above the histograms in panels a and b are representative Western blots of data from the three experimental groups. The results are expressed as a ratio of control group. CON control animals, CMV controlled mechanical ventilation, CMVC CMV treated with calpeptin. CMV rats received corresponding volumes of vehicle. ***p < 0.001, #p < 0.05
