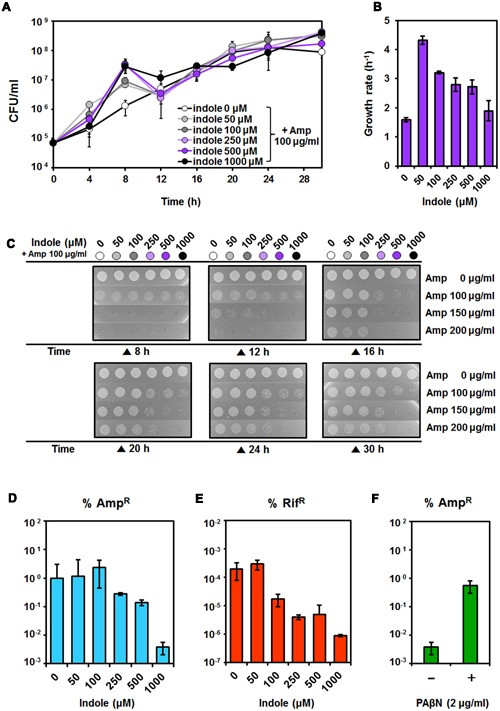
FIGURE 4.

Amp resistance induced by heterogeneous response to indole. (A) Growth was monitored by counting colony forming units (CFUs) in the presence of indole with 100 μg/ml Amp. (B) Growth rates in each condition at 0–4 h of incubation, as shown in Figure 4A. (C) Amp susceptibility test of cells taken from cultures in 100 μg/ml Amp with various concentrations of indole, as shown in Figure 4A. Cells were harvested at the indicated time points (8, 12, 16, 20, 24, and 30 h of incubation) and washed to remove residual chemicals. The same number of cells was spotted on plates containing Amp (0, 100, 150, and 200 μg/ml) and incubated for 24 h. The percentage of mutated cells (D,E) was determined as follows. Cells harvested from cultures grown in 100 μg/ml Amp with various concentration of indole, as shown in Figure 4A. The percentages of mutated cells showing Amp resistance (AmpR) (D) and Rif resistance (RifR) (E) were determined from the relative percentages of CFU/ml [(CFU obtained from the antibiotic plate/total number of CFU obtained from the LB plate) × 100]. (F) Percentage of Amp-resistant (AmpR) cells in the presence of an efflux pump inhibitor. Cells were inoculated into LB medium containing 100 μg/ml Amp and 1000 μM indole with or without 2 μg/ml PAβN and incubated for 30 h at 30°C. Appropriate dilutions of the cells were spread on LB plates containing 200 μg/ml Amp. The total number of CFUs was determined on LB agar plates. All data represent the average of three replicates, and the error bar indicates the standard deviation.
