
FIGURE 6.
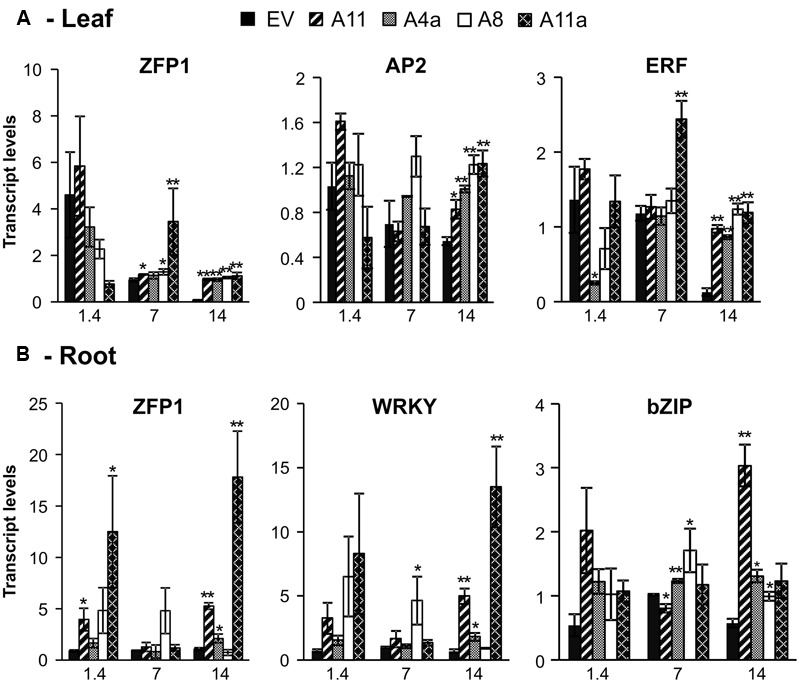
Relative transcript levels of abiotic stress responsive transcription factors in leaves (A) and roots (B). Data are average of 3–4 biological replicates for each genotype at each stress level. Single asterisk (∗) shows significance at P < 0.05 and double asterisk (∗∗) indicates P < 0.01 (t-test) between EV and miR156OE genotypes within each stress level (control; EC = 1.4 dSm-1, mild; EC = 7 dSm-1, severe; EC = 14 dSm-1).