
Figure 5.
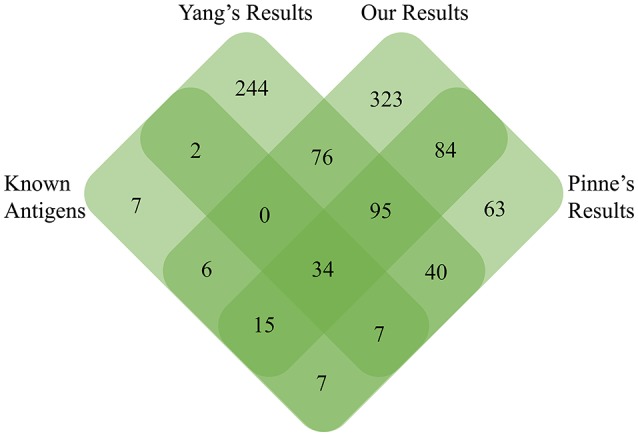
Venn diagram detailed the unique and common PSEs among our negative-screening, Yang's positive-screening, and Pinne's OMP array results with known experimentally identified surface-exposed antigens.
Official websites use .gov
A
.gov website belongs to an official
government organization in the United States.
Secure .gov websites use HTTPS
A lock (
) or https:// means you've safely
connected to the .gov website. Share sensitive
information only on official, secure websites.
Venn diagram detailed the unique and common PSEs among our negative-screening, Yang's positive-screening, and Pinne's OMP array results with known experimentally identified surface-exposed antigens.