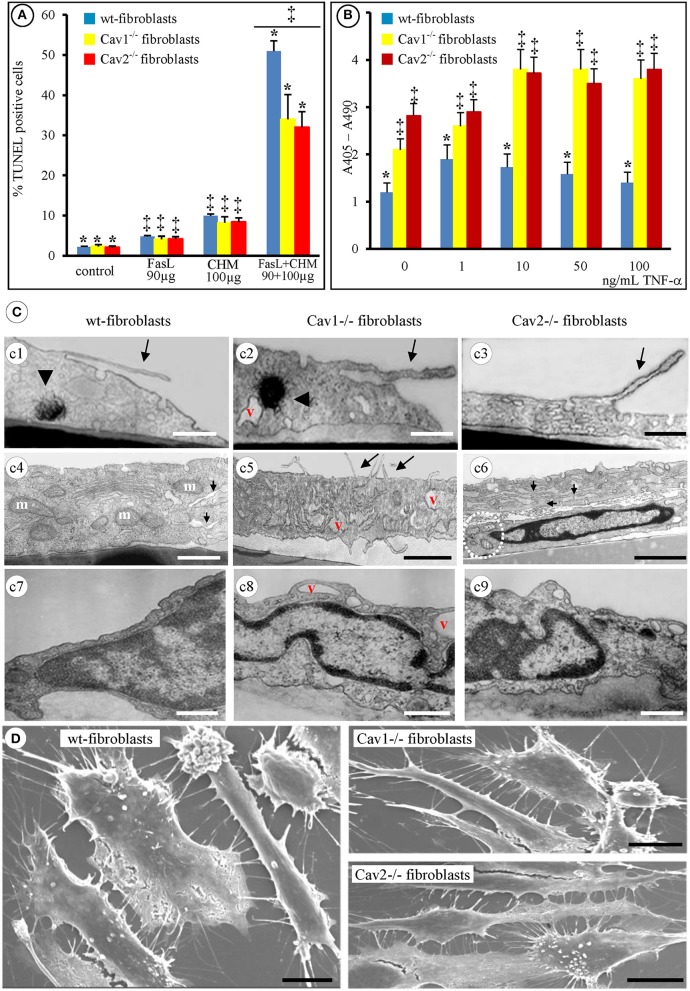
Figure 2.
Apoptotic-resistance characteristics of wt- and Cav-null fibroblasts. (A) Mouse fibroblasts (wt-, Cav1−/−, and Cav2−/−) exposed, for 24 h, to either 90 μg/mL FasL or 100 μg/mL CHM are resistant to apoptosis; combined FasL + CHM treatment induces their apoptotic death; n = 8, *p < 0.01 vs. control (untreated fibroblasts) and ‡p < 0.05 vs. FasL or CHM alone. The differences between FasL and CHM treated fibroblast did not reach statistical significance, p < 0.24, n = 8. (B) TNF-α treatment (2 h) induces apoptosis in all fibroblasts in a concentration dependent manner. n = 5; *p < 0.001, ‡p < 0.05. (C) By TEM [4 h post FasL (c1, c2, c3) and 2 h (c4, c5, c6)] all fibroblasts show filopodial extension (c1, c2, c3, c5, arrows), display myelinic bodies (c1, c2, arrowheads), show increase in the number of mitochondrial units [c4 (m), c6 (circled area)], along with enlarged ER (c4, c6, arrows) and display increased number of cytoplasmic vacuoles (v; c2, c5, c8). Representative electron micrographs demonstrate the nuclear condensation in all three types of fibroblasts (c7–c9) and no differences in dismantling of cellular nuclei (c6, c7, c8, c9); Bars: 250 nm (c1–c9); n = 6. (D) Scanning EM (8 h post-FasL treatment of fibroblasts isolated from 2 months old mice) reveals the extent of cellular blebbing and the abundance of filopodial projections in mouse fibroblasts after FasL-treatment. Bars: 25 μm; n = 8.

