
Figure 3.
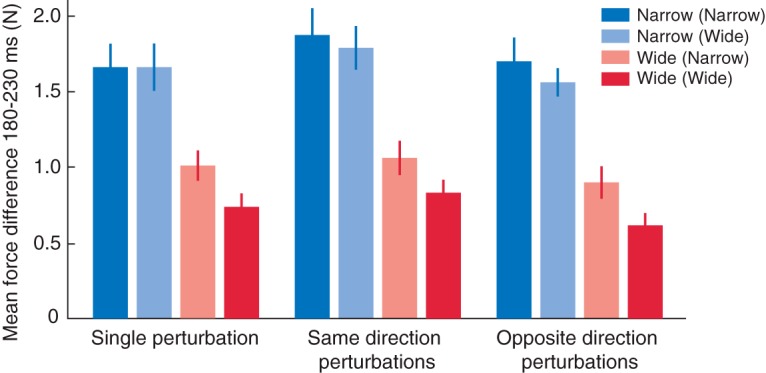
Visuomotor responses in experiment 2. Bars represent the mean force differences at a single hand averaged across the 180- to 230-ms interval following the cursor perturbation. Error bars represent ±1 SEM. Target sizes in parentheses indicate the size of the target of the other hand.