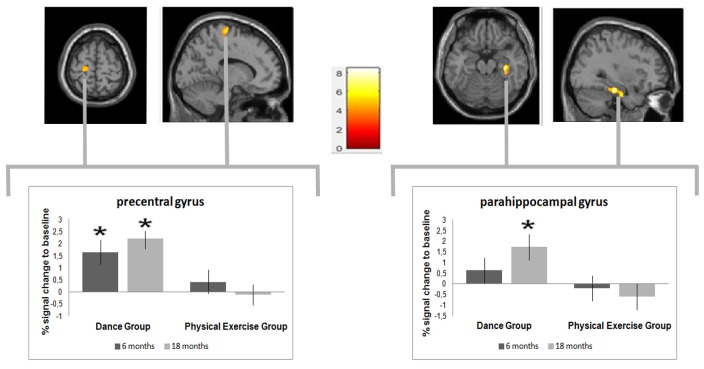
Figure 3.
Time by group interaction analysis, testing for greater volume changes in the dance compared with the sport group. A significant increase in gray matter was found in the precentral gyrus (Montreal Neurological Institute (MNI)-coordinates: x = −16; y = −18; z = 77) and in the parahippocampal gyrus gyrus (MNI-coordinates: x = 34; y = −26; z = −20). The box plots show the relative gray matter changes in the peak voxel. *p ≤ 0.05.

