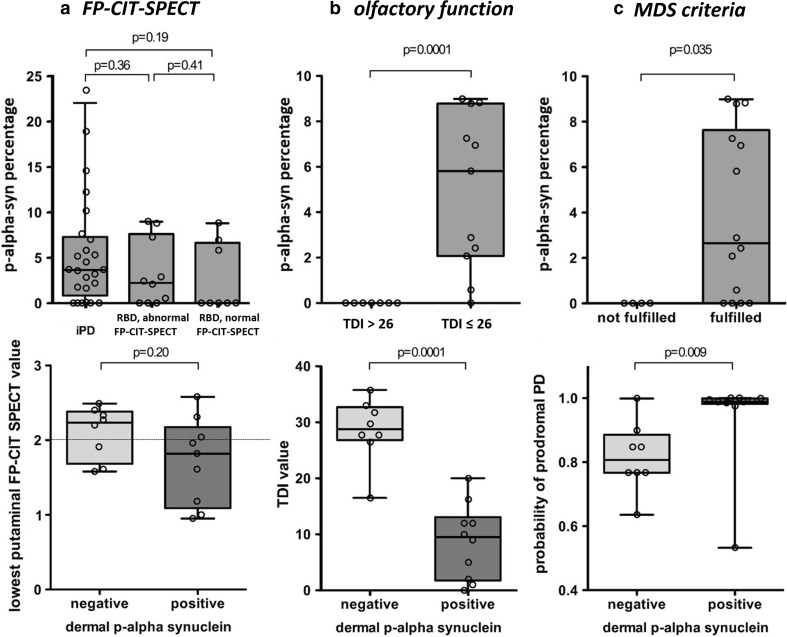
Fig. 3.
Box plots illustrating skin biopsy, FP-CIT-SPECT, LR and TDI data. The box plots of the upper panels a–c illustrate the median percentage of p-alpha-syn-positive dermal nerve structures per patient (y-axis) in patients with abnormal/normal FP-CIT-SPECT (a), normosmic (TDI > 26)/hyposmic (TDI ≤ 26) patients (b) and patients fulfilling/not fulfilling the research MDS criteria of prodromal PD (x-axis) (c). In a, upper panel, PD patients are included, all other panels only represent the RBD group. The black line marks the median, the box represents the quartiles, the whiskers mark the range. Individual patient values are represented by circles. The percentage of p-alpha-syn-positive dermal structures shows a trend towards higher numbers in PD, declining from PD to RBD with abnormal, FP-CIT-SPECT (i.e. reduced specific to non-specific binding ratio) and further to RBD with normal FP-CIT-SPECT (a). P-alpha-syn deposition is not found in normosmic patients, but is high in hyposmic patients (b) and is much more abundant in patients fulfilling the MDS criteria of prodromal PD (c). The box plots of the lower images a–c compare the lowest putaminal FP-CIT-SPECT values, TDI values and the probability of prodromal PD (y-axis) in patients without (negative) and with (positive) p-alpha-syn deposition in the skin biopsy (x-axis). Putaminal FP-CIT-SPECT values tend to be lower in patients with at least one p-alpha-syn deposition (positive) vs in patients with no deposition (negative) (a). In a the punctate line indicates the lower normal value (2.0) of the FP-CIT-SPECT value. TDI values (b) are significantly lower in patients with p-alpha-syn deposits in the skin biopsy and the probability of prodromal PD is higher in patients with p-alpha-syn deposition (c). In a, lower panel, only 17 individual patient values are represented by circles as the FP-CIT-SPECT of one patient was not included into the quantitative analysis due to lack of raw data. FP-CIT-SPECT 123I-2beta-carbomethoxy-3beta-(4-iodophenyl)-N-(3-fluoropropyl)-nortropane single photon emission computed tomography, p-alpha-syn phosphorylated alpha-synuclein, PD Parkinson’s disease, RBD REM sleep behaviour disorder, TDI olfactory threshold, discrimination and identification score

