Fig. 1.
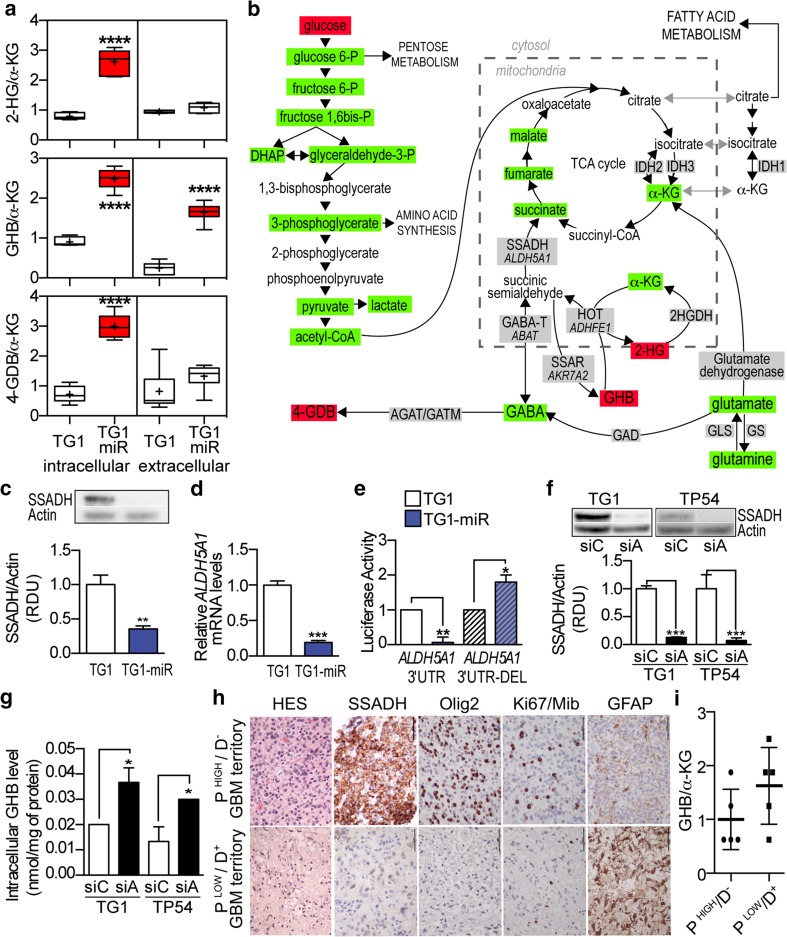
Loss of stem and tumorigenic properties by GBM stem-like cells is accompanied with GABA metabolism deregulation characterized by enhanced GHB levels. a Increased GABA by-products to α-KG ratios in TG1-miR compared to TG1. The “+” sign represents the mean value in the whisker box. Mean ± SD, n = 6 independent biological samples. b Schematic reconstruction of metabolic pathways with green and red boxes signaling metabolites decreased or increased in TG1-miR compared to TG1, respectively. Enzyme names are within grey boxes. When relevant, the corresponding gene designation is indicated below the enzyme name. SSADH: succinic semialdehyde dehydrogenase. SSAR succinic semialdehyde reductase. c Downregulation of the ALDH5A1 protein product SSADH in TG1-miR. Western blot analysis. SSADH MW, 57 kDa; Actin MW, 42 kDa. Mean ± SD, n = 3 independent biological samples. d Decreased ALDH5A1 mRNA levels in TG1-miR compared to TG1. Q-PCR assays. Mean ± SD, n = 3 independent biological samples. e Targeting of the ALDH5A1 transcript by miR-302. Expression of Renilla Luciferase mRNA containing the wild-type form of ALDH5A1-3′UTR is strongly reduced in TG1-miR compared to TG1. Deletion of miR-302 putative target sequence in the 3′UTR of ALDH5A1 mRNA (ALDH5A1-3′UTR-DEL) prevents the binding of the miR, and rescues luciferase activity. n = 3 independent biological samples. f Decreased SSADH levels in GBM and DIPG stem-like cells (TG1, TP54) upon ALDH5A1 downregulation with siRNAs (siA). siC (control siRNA). Mean ± SD, n = 3 independent biological samples. RDU, relative densitometry units. g ALDH5A1 down regulation results in enhanced GHB intra-cellular levels. Mean ± SD, n = 3 independent biological samples. h SSADH immunoreactive cells are enriched in proliferative/non-differentiated GBM territories (P HIGH/D −) and rare in non-proliferative/differentiated (P LOW/D +) tumor territories of patients’ GBM, as revealed by immunohistochemical staining of Ki67, Olig2, and GFAP. HES: hematoxylin and eosin staining. Scale bar 100 µm. i GHB/α-KG ratios in proliferative/non-differentiated (P HIGH/D −) and weakly proliferative/differentiated territories (P LOW/D +) of patient GBM. GC–MS/MS analysis. Mean ± SD, n = 5 independent patient’s GBM neurosurgical samples

