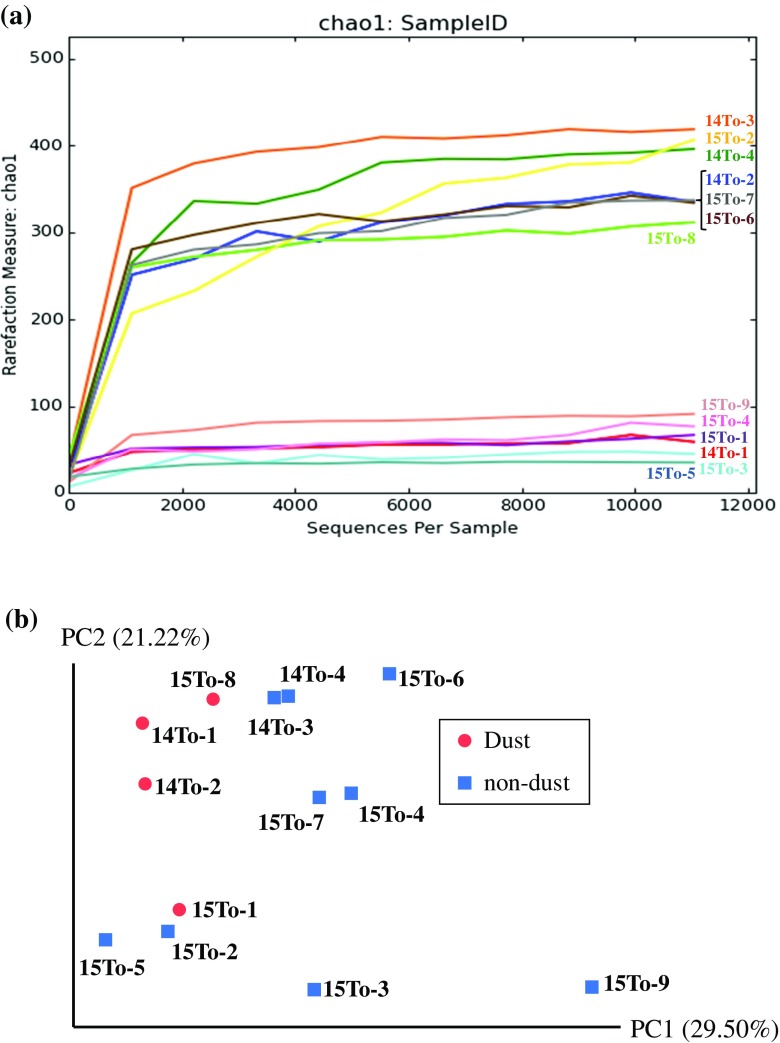
Fig. 6.
Comparison of bacterial compositions among the air samples collected at the sampling site of Tsogt-Ovoo City for March 16–18 in 2014 (from 14To-1 to 14To-4), March 7–11 in 2015 (from 15To-1 to 14To-7), and April 26–27 in 2015 (15To-8 and 15To-9). a Rarefaction curves indicating the bacterial diversity observed in the air samples. Species were binned at the 97 % sequence similarity level. b Non-metric multidimensional scaling plot with weighted-UniFrac distance matrix displaying phylogenetic clustering by the air samples

